While carbon dioxide (CO2) and methane (CH4) tend to receive the most attention as major components of Earth's carbon budget, nitrous oxide (N2O) is actually a more potent greenhouse gas (GHG). Given its long lifetime in the atmosphere, N2O has a Global Warming Potential almost almost 300-times that of CO2. And although it is less important than CO2 in terms of atmospheric concentrations, N2O emissions have risen significantly since the Industrial Revolution. A new paper in Nature presents an updated view of the N2O budget, including both natural and anthropogenic "sources" and "sinks" of N2O emissions.
The authors used both a "top-down" (from an atmospheric model) and "bottom-up" (e.g. scaling-up local flux measurements) approaches, and come to remarkably similar agreements in the total N2O emissions between 2007 and 2016: 16.9 Tg N for the former and 17.0 for Tg N the latter.
The authors used both a "top-down" (from an atmospheric model) and "bottom-up" (e.g. scaling-up local flux measurements) approaches, and come to remarkably similar agreements in the total N2O emissions between 2007 and 2016: 16.9 Tg N for the former and 17.0 for Tg N the latter.
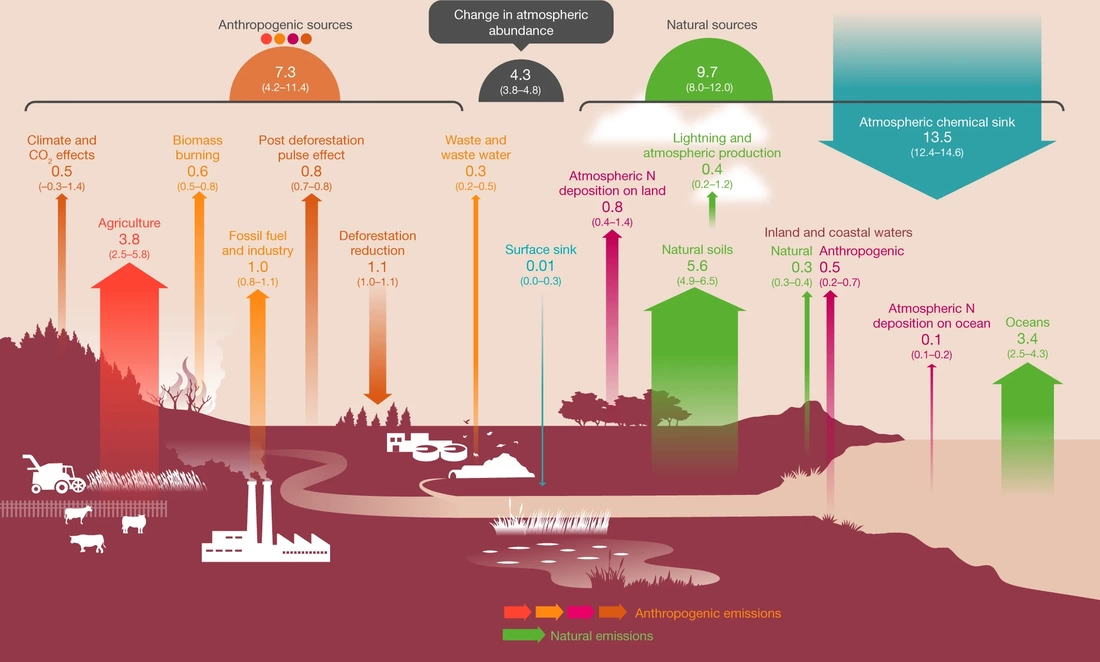
An updated global N2O emissions budget from Figure 1 of Tian et al. 2020. Anthropogenic sources are on the left and natural sources are on the right.
The most significant anthropogenic source from land was agriculture, specifically due to N additions to cropland. While natural soils can also act as a source of N2O, the authors found that over this time period, natural sources remained relatively constant while anthropogenic sources contributed most to the increase in emissions. The interactions with ongoing climate change and emissions can also be quite complex. For example, the study noted that increases in CO2 can help reduce N2O emissions by enhancing N uptake, but warming temperature may accelerate microbial processes which release N2O from soils. Additionally, land use can also complicate the picture. The conversion of forestland, which naturally have high N2O emissions, to unfertilized crops or pastureland is often offset by emissions due to long-term N loading to fields and nearby aquatic ecosystems.
The authors also looked at how N2O emissions vary geographically. They found that while Africa and South America have seen the largest increases in N2O emissions over the past decade, there still is work to be done sourcing N2O from these regions as their different modelling methods showed less agreement. Currently, it is suspected that N2O emissions in these regions are largely from tropical forest soils, livestock, and manure compared to synthetic N fertilizer applications in East Asia, North America, and Europe.
The authors also looked at how N2O emissions vary geographically. They found that while Africa and South America have seen the largest increases in N2O emissions over the past decade, there still is work to be done sourcing N2O from these regions as their different modelling methods showed less agreement. Currently, it is suspected that N2O emissions in these regions are largely from tropical forest soils, livestock, and manure compared to synthetic N fertilizer applications in East Asia, North America, and Europe.
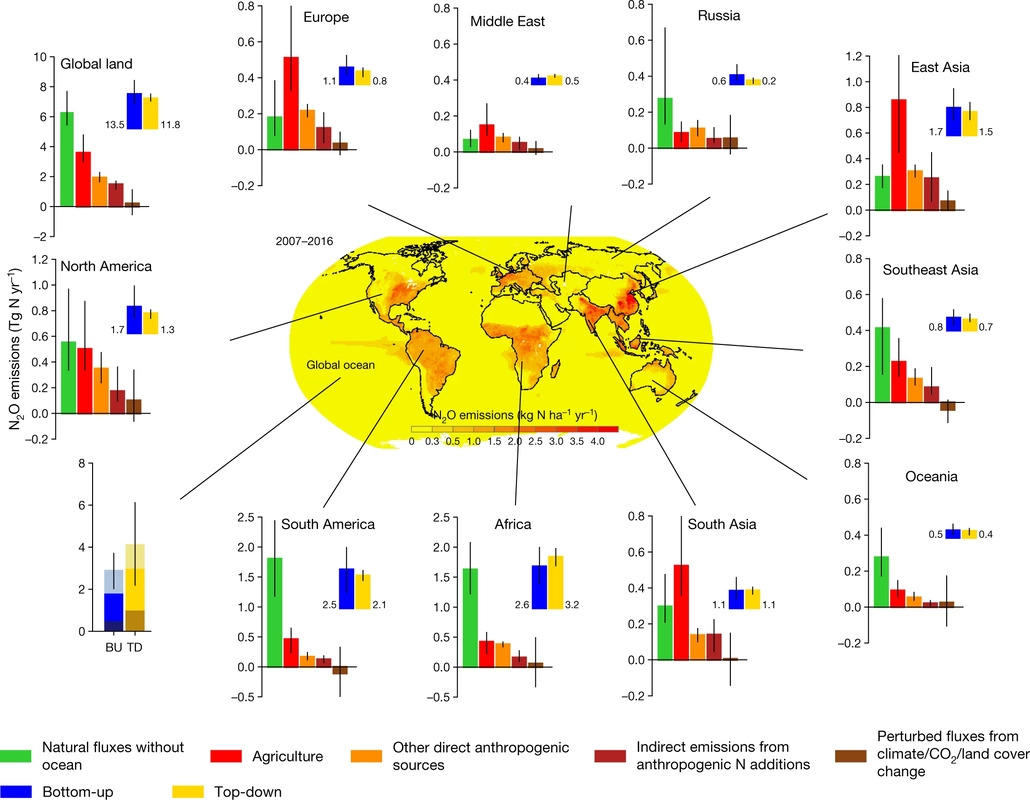
Regional budgets of N2O emissions from various sources and a spatial distribution of N2O emissions from land and ocean models in the center. From Figure 2 of Tian et al. 2020.
Regional differences also mirrored changes in policies and population growth. For example, emissions have been growing rapidly in developing nations such as China, India, and Brazil. However, in Russia emissions have declined due to the collapse of the Soviet agricultural system in the 1990s. The authors suggest N2O can be abated in emerging economies even as agricultural N demand increases. European emissions have decreased due to better industrial and agricultural practices, so applying existing sustainable agriculture and technological advances worldwide can successfully mitigate N2O emissions. As atmospheric N2O concentrations continue to rise globally, these decisions need to be made sooner rather than later.
 RSS Feed
